The Bollinger Bands
Introduced by John Bollinger in the 1980s, Bollinger Bands (BB) is perhaps one of the most useful technical analysis indicators. BB is used to determine overbought and oversold levels, where a trader will try to sell when the price reaches the top of the band and will execute a buy when the price reaches the bottom of the band.
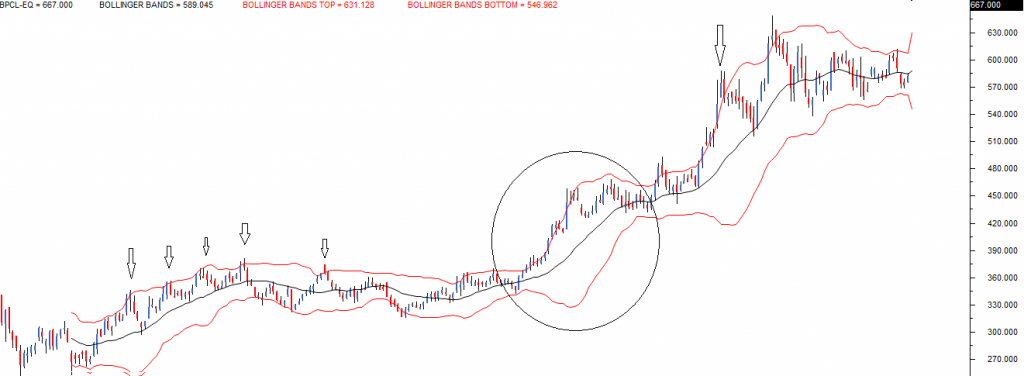
The following is the chart of BPCL Limited,
The BB has 3 components:
- The middle line which is The 20 day simple moving average of the closing prices
- An upper band – this is the +2 standard deviation of the middle line
- A lower band – this is the -2 standard deviation of the middle
In BB, the standard deviation is applied on the 20 days SMA. The upper band indicates the +2 SD. Using a +2 SD, we multiply the SD by 2 and add it to the average.
We now have the components of the BB:
- 20 day SMA = 7800
- Upper band = 7950
- Lower band = 7650
Case 1
Statistically speaking, the current market price should hover around the average price of 7800. However, if the current market price is around 7950, it is considered expensive concerning the average. Hence one should look at shorting opportunities with an expectation that the price will scale back to its average price.
Therefore the trade would be to sell at 7950, with a target of 7800.
Case 2
Likewise, if the current market price is around 7650, it is considered cheap concerning the average prices. Hence, one should consider buying opportunities to expect that the prices will scale back to its average price.
Therefore the trade would be to buy at 7650, with a target of 7800.
The upper and lower bands act as a trigger to initiate a trade.
Points to Remember
The BB’s upper and lower band together forms an envelope. The envelope expands, whenever the price drifts in a particular direction, indicating strong momentum. The BB signal fails when there is an envelope expansion. This leads us to an important conclusion; BB works well in sideways markets and fails in a trending market.