Relative Strength Index
Relative strength Index or just RSI, is a prevalent indicator developed by J.Welles Wilder. RSI is a leading momentum indicator which helps in identifying a trend reversal. RSI indicator oscillates between 0 and 100 and based on the latest indicator reading, the expectations on the markets are set.
The term “Relative Strength Index” can be a bit misleading as it does not compare the relative strength of two securities, but instead shows the internal strength of the security. RSI is the most popular leading indicator, which gives out the strongest signals during the periods of sideways and non-trending ranges.
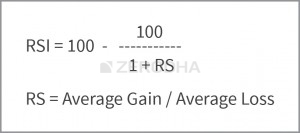
The formula to calculate the RSI is as follows:
We can interpret RSI in many different ways besides the classical interpretation (which we discussed earlier):
-
If the RSI is fixed in an overbought region for a prolonged period, look for buying opportunities instead of shorting. The RSI stays in the overbought region for a prolonged period because of an excess positive momentum.
-
If the RSI is fixed in an oversold region for a prolonged period, look for selling opportunities rather than buying. RSI stays in the oversold region for a prolonged period because of an excess negative momentum
-
If the RSI value starts moving away from the oversold value after a prolonged period, look for buying opportunities. For example, the RSI moves above 30 after a long time may mean that the stock may have bottomed out, hence a case of going long.
-
If the RSI value starts moving away from the overbought value after a prolonged period, look for selling opportunities. For example, RSI moving below 70 after a long time. This means the stock may have topped out, hence a case for shorting.
Note
None of the parameters used while analyzing RSI should be treated with rigidity. Finally, do remember RSI is not used often as a standalone indicator by traders; it is used along with other candlestick patterns and indicators to study the market.