Moving Average Convergence and Divergence (MACD)
MACD is all about the convergence and divergence of the two moving averages. Convergence occurs when the two moving averages move towards each other, and divergence occurs when the moving averages move away. A standard MACD is calculated using a 12 day EMA and a 26 day EMA. Please note, both the EMA’s are based on the closing prices. We subtract the 26 EMA from the 12 day EMA, to estimate the convergence and divergence (CD) value. A simple line graph of this is often referred to as the ‘MACD Line’. Let us go through the math first and then figure out the applications of MACD.
The sign associated with the MACD just indicates the direction of the stock’s move. For example, if the 12 Day EMA is 6380, and 26 Day EMA is 6220, the MACD value is +160. Under what circumstance do you think the 12 day EMA will be greater than the 26 day EMA? Well, we had looked into this in the moving average chapter. The shorter-term average will generally be higher than the long term only when the stock price trends upward. Remember, the shorter-term average will always be more reactive to the current market price than the long term average. A positive sign tells us that there is positive momentum in the stock, and the stock is drifting upwards. The higher the momentum, the higher is the magnitude. For example, +160 indicate a positive trend which is stronger than +120.
Note- However, while dealing with the magnitude, always remember the price of the stock influences the magnitude. For example, the higher the underlying price such as Bank Nifty, naturally, the higher will be the magnitude of the MACD.
MACD Speed- The difference between the two moving averages is called the MACD spread. The spread decreases when the momentum mellows down and increases when the momentum increases. To visualize convergence and the divergence traders usually plot the MACD value chart, often referred to as the MACD line.
Traders generally argue that while waiting for the MACD line to crossover the centerline, a bulk of the movie would already be done and perhaps it would be late to enter a trade. To overcome this, there is an improvisation over this basic MACD line. The improvisation comes in the form of an additional MACD component which is the 9-day signal line. A 9-day signal line is an exponential moving average (EMA) of the MACD line. If you think about this, we now have two lines:
The chart below plots the MACD indicator on Asian Paints Limited. You can see the MACD indicator below the price chart.
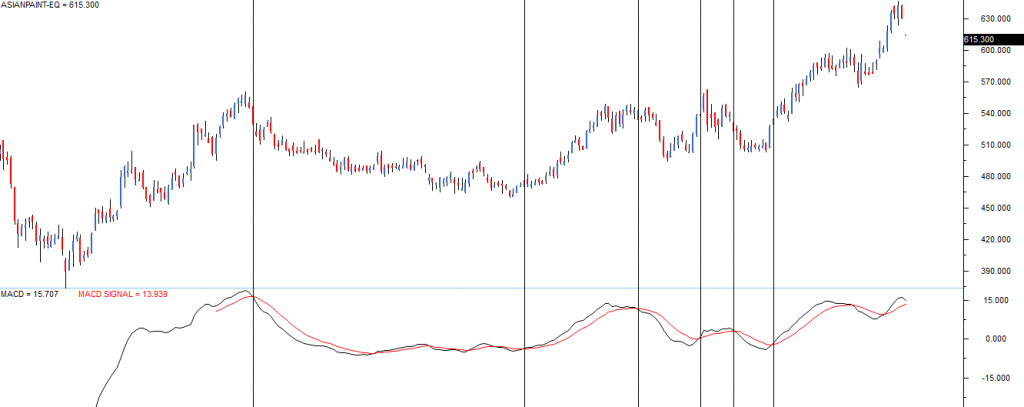
The indicator uses standard parameters of MACD:
- 12 day EMA of closing prices
- 26 day EMA of closing prices
- MACD line (12D EMA – 26D EMA) represented by the black line
- 9 day EMA of the MACD line represented by the red line
The chart’s vertical lines highlight the chart’s crossover points where a signal to buy or sell originated.
For example, the first vertical line starting from left points to a crossover where the MACD line lies below the signal line (9 day EMA) lies and suggests a short trade.
The 2nd vertical line from left points to a crossover where the MACD line lies above the signal line should look at buying opportunity. So on and so forth.
Note
At the core of the MACD system, are moving averages. Hence the MACD indicator has similar properties like that of a moving average system. They work quite well when there is a strong trend and are not too useful when moving sideways. You can notice this between the 1st two-line starting from left.